TABLE OF CONTENTS
::pwtk::splot
SYNOPSIS
proc ::pwtk::splot {args} {
USAGE
   splot  ?OPTIONS?  DATAFN

 where DATAFN is either a datafile or a function to plot, and
 OPTIONS are:

    -type TYPE
    -pal  PALETTE
    -i    INTERPOLATION
    -contour
    -cc   CONTOUR_COLOR
    -clw  CONTOUR_LINEWIDTH
    -xl   XLABEL
    -yl   YLABEL
    -zl   ZLABEL
    -xr   XRANGE
    -yr   YRANGE
    -zr   ZRANGE
    -cbr  CBRANGE
    -xf   XFORMAT
    -yf   YFORMAT
    -zf   ZFORMAT
    -cbf  CBFORMAT
    -u    USING
    -w    WITH
    -e    EXTRA
    -t    TERMINAL
    -v
OPTIONS
Options specific for 3D surface plots:
- -type TYPE --- type of the Gnuplot splot: surface | both (default = surface; "TYPE = both" means surface + map)
- -pal PALETTE --- color palette for the splot (PWTK has a dozen predefined palettes, see the image below)
- -i NX,NY --- interpolation degree along X- and Y-axis (default is set to auto-optimal interpolation)
- -contour --- plot contours
- -cc CONTOUR_COLOR --- assigns contour color
- -clw CONTOUR_LINEWIDTH --- contour linewidth
General options:
- -xl XLABEL --- X-axis label
- -yl YLABEL --- Y-axis label
- -zl ZLABEL --- Z-axis label
- -xr XRANGE --- X-axis range specified as XMIN:XMAX or {XMIN:XMAX} or "XMIN:XMAX"
- -yr YRANGE --- Y-axis range specified as YMIN:YMAX or {YMIN:YMAX} or "YMIN:YMAX"
- -zr ZRANGE --- Z-axis range specified as ZMIN:ZMAX or {ZMIN:ZMAX} or "ZMIN:ZMAX"
- -cbr CBRANGE --- CB-axis range specified as CBMIN:CBMAX or {CBMIN:CBMAX} or "CBMIN:CBMAX"
- -xf XFORMAT --- format for X-axis (e.g. %.2f)
- -yf YFORMAT --- format for Y-axis (e.g. %.2f)
- -zf ZFORMAT --- format for Z-axis (e.g. %.2f)
- -cbf CBFORMAT --- format for CB-axis (e.g. %.2f)
- -u USING --- Gnuplot's "using" splot specification
- -w WITH --- Gnuplot's "with" splot specification
- -e EXTRA --- extra Gnuplot commands/configuration, e.g., -e {set nokey; set title 'simple plot'}
- -t TERMINAL --- terminal for the plot
- -v --- visualize the generated image(s) (for file terminals)
ARGUMENT
- datafile --- datafile to plot
PURPOSE
A fast way of making an splot from the x, y, f(x,y) tabulated data. For a more elaborate 3D plotting, use the ::pwtk::gp::splot object-oriented interface instead.
The PWTK's predefined color palettes can be accessed with the -pal option. To invert a palette, use "-pal {PALETTE negative}", where PALETTE is one of:
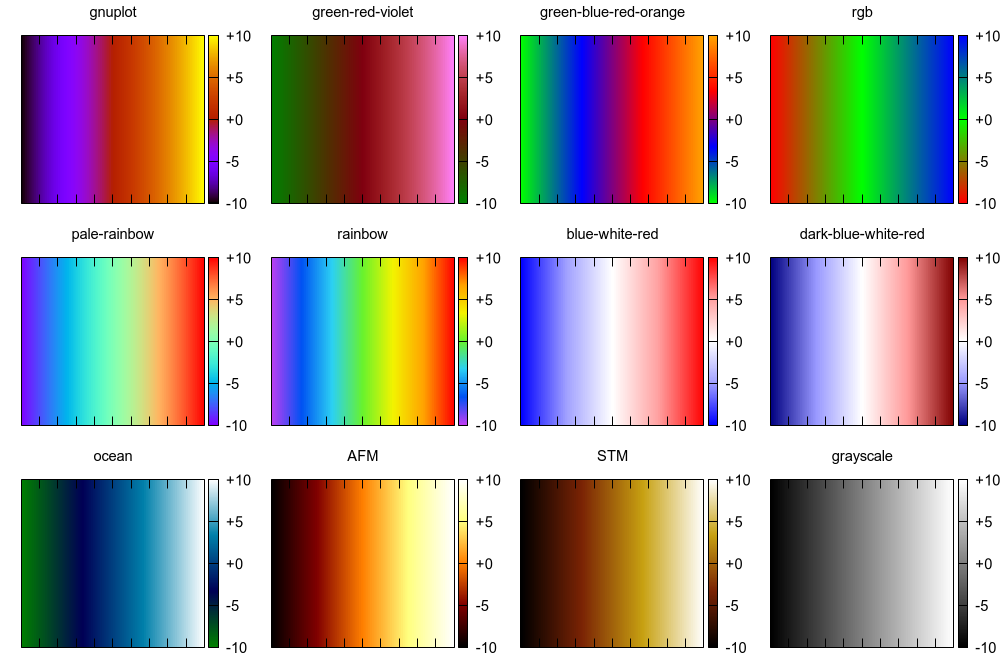
Note that for PALETTE only a substring that uniquely identifies it is required. For example, "-pal pa" selects the "pale-rainbow" palette.
RETURN VALUE
- the name of created image (for file terminals)
- an empty string (for non-file terminals)
SOURCE
    variable write_fid
    variable plot_id

    # parse args

    set narg 1
    ::pwtk::splotParseOpt_

    # datafile or function ?

    if { [file exists $args] } {
        # lastarg is a file
        finish $args
        set head   splot-[file rootname $args]
        set datafn [squote $args]
    } else {
        # lastarg is a function
        set id [incr ::pwtk::gp::splot_id]
        set head   splot-$id
        set datafn $args
    }

    # options post-processing

    set opts ""
    ifnotempty opt(pal) { append opts "[list -pal $opt(pal)] " }
    ifnotempty opt(cc)  { append opts "[list -cc $opt(cc)] " }
    if { ! $opt(contour) } { append opts "-nocontour " }

    ifnotempty opt(clw) { set opt(clw) "lw $opt(clw)" }
    ifnotempty opt(u)   { set opt(u)   "u $opt(u)" }
    ifset opt(w) l
    set with [concat w $opt(w) $opt(clw)]

    # create Gnuplot splot object

    set gp [::pwtk::gp::splot new -type $opt(type) {*}$opts $head.$opt(t)]

    # add options + add excerpts

    ::pwtk::splotOptionsAdd_

    # plot

    $gp plot [concat $datafn $opt(u) $with]
    $gp exec
    set output [$gp outputs]
    $gp destroy

    displayPlots_ $opt(v) $opt(t) $output

    return $output
}